Assignment 3
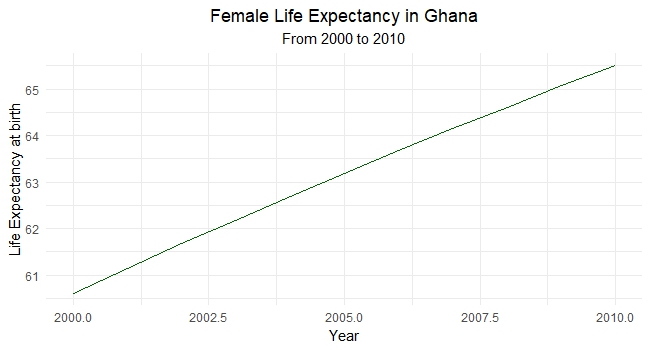
Plot 1 - Female Life Expectancy at Birth in Ghana
This represents Female Life Expectancy at birth. This line graph used data from Ghana. The IDBR package was used to generate the plot.
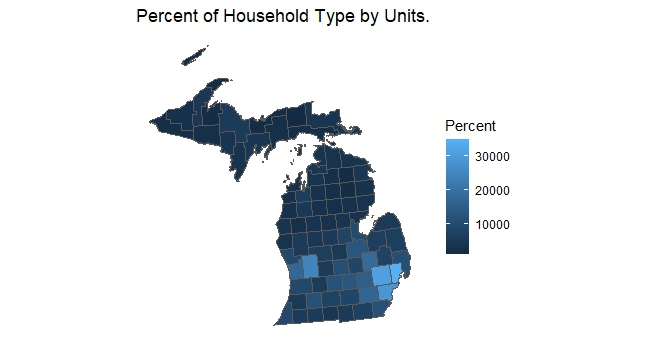
Map 1 - Household Type by Units
This is a map of the State of Michigan. Tidycensus was used to retrieve ACS 5-year data (2017-2021). The data chosen for the representation was Household Type by Units.
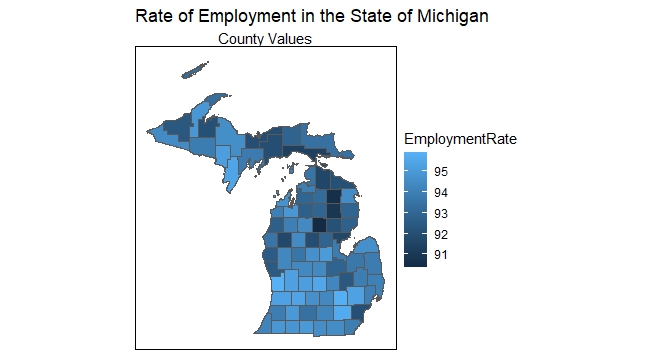
Map 2 - Rate of Employment in the State of Michigan
Gathered data from Michigan Department Technology, Management & Budget - Michigan Labour Market Information on Employment and Unemployment Statistics(2022). This made use of an excel file.